Which NYC Condos Sold for More Than Their Price List?
A new condo's offering plan starts with a price list. We read NYC offering plans and lined up each home's original price with what it actually closed for in city deed records, to see which buildings beat their own launch prices and what that means for you as a buyer.
Every new NYC condo starts with a price list. It's called Schedule A, the table in the offering plan (the sponsor's disclosure document, filed with the New York Attorney General) that gives each home's original asking price. Once a home closes, the deed price is recorded with the city in ACRIS, NYC's public property records. Put the two side by side and you can see which developers launched at prices the market went on to beat.
We read the Schedule A price lists in 1,223 NYC condo offering plans and matched them to first closings. Here's what we found, and what it means if you're buying new.
The Headline: Most Buildings Close Below the Launch List
Beating the price list is the exception. Among 349 buildings with enough closings to judge (plans accepted since 2010, at least 10 homes matched), the median building closed 2.7% below its original Schedule A. About 60% closed below it in total.
Only 10% came in 10% or more above. That's 34 buildings. Those are the developers who priced early and watched the market move their way.
Biggest Jump Over the Price List
Ranked by how far closings came in above Schedule A, in percent. 7 Whipple Street leads at +43.3%. 5 of the top 5 have 30 homes or fewer. In a small building, a modest dollar gain is a big percentage.
-
7 Whipple Street
7 Whipple Street · Brooklyn

3D massing, not a photo. The building is in green. +43.3% over Schedule A. The 18 homes we could match closed for $17 million, against $11.9 million on the original price list. First closings ran from Dec 16, 2020 to Feb 24, 2022.
Our take: The price list looks like a floor, not a forecast. Every home we matched closed above its line, and nearly half closed just under $1 million, the point where New York's mansion tax starts. Our read: the sponsor launched with a list set before the plan was accepted in mid-2020, then repriced up to that line once buyers came back that winter.
-
Sunlight Terrace
52-16 Roosevelt Avenue · Queens
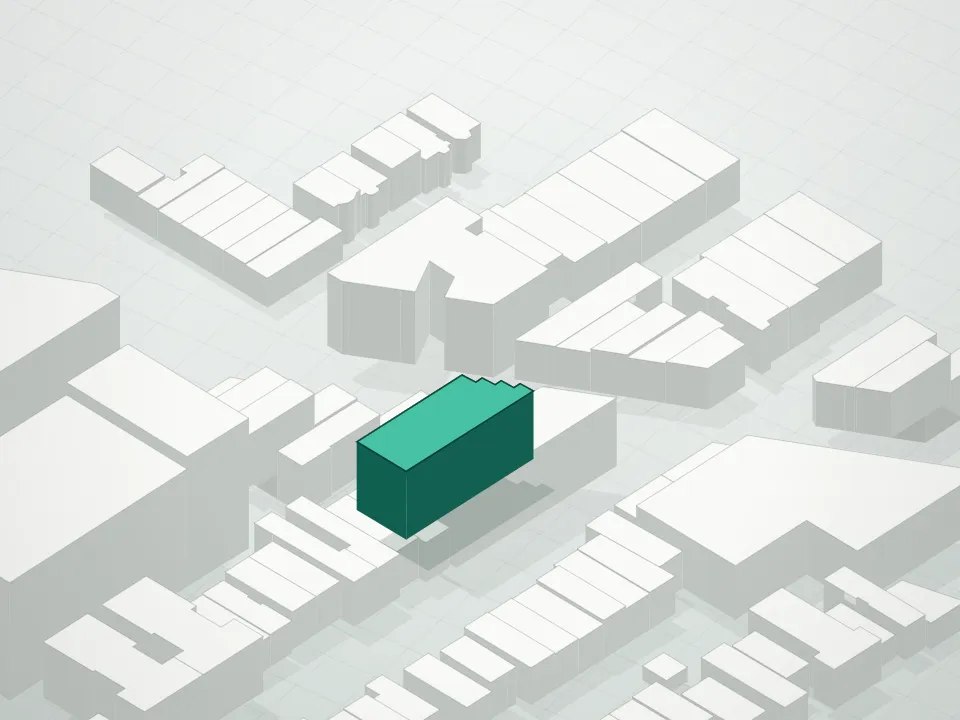
3D massing, not a photo. The building is in green. +41% over Schedule A. The 10 homes we could match closed for $5.2 million, against $3.7 million on the original price list. First closings ran from Jun 29, 2023 to Jun 5, 2026.
Our take: A small building of mostly one-bedrooms on Roosevelt Avenue, under the 7 train, listed at prices that left plenty of room. The first six homes all closed in 2023 far above their lines; the ones that closed in 2025 and 2026 beat the list by much less. Our read: most of the gain came from repricing a cheap launch list, not from the market rising afterward.
-
516 Classon Avenue
516 Classon Avenue · Brooklyn

3D massing, not a photo. The building is in green. +37% over Schedule A. The 16 homes we could match closed for $12.4 million, against $9.1 million on the original price list. First closings ran from Aug 10, 2016 to May 22, 2018.
Our take: Filed at the end of 2015 and sold through Brooklyn's 2016–2017 run-up, so the list was stale by the time homes closed. The early closings beat it by the most; the last three, all small one-bedrooms, closed below their lines. Our read: classic timing, with the upside front-loaded and fading as the building sold out.
-
74-25
74-25 43rd Avenue · Queens

3D massing, not a photo. The building is in green. +31.6% over Schedule A. The 10 homes we could match closed for $5.7 million, against $4.4 million on the original price list. First closings ran from Jun 22, 2022 to Feb 10, 2026.
Our take: The list priced every two-bedroom at nearly the same round number, whatever its size, and the three-bedrooms only a little higher. Those three-bedrooms beat the list by the most. Our read: a placeholder list in a neighborhood short on new family-size homes, with the real pricing happening at contract.
-
27 Kossuth Place
27 Kossuth Place · Brooklyn · Developer: Urban View Development Group Inc.

3D massing, not a photo. The building is in green. +28.6% over Schedule A. The 10 homes we could match closed for $6.4 million, against $5 million on the original price list. First closings ran from Apr 9, 2019 to Sep 21, 2020.
Our take: A round-number list (whole hundred-thousands), and every home closed above it at a steady margin, even through spring 2020. Our read: the list was set conservatively in 2018 and Bushwick demand carried every sale past it, rather than one or two standout deals.
Most Dollars Over the Price List
Ranked by total dollars above Schedule A. Here the big Manhattan towers take over: One57 closed $94.5 million above its original list, only +5.4% in percentage terms but spread across 90 homes. 5 of the top 5 are in Manhattan.
-
One57
157 West 57th Street · Manhattan · Developer: Extell Development Company

3D massing, not a photo. The building is in green. $94.5 million over Schedule A (+5.4%) across 90 matched homes. First closings ran from Dec 19, 2013 to Sep 18, 2023.
Our take: First to market on Billionaires' Row. Its plan was accepted in 2011, and most homes closed in 2014 and 2015, when Manhattan's top end peaked, above the 2011 list. A single large home accounts for over a quarter of the dollar gap. Homes that closed from 2019 on, after the newer towers nearby arrived, went below their lines. Our read: the win was being early; the sponsor's late sales gave much of it back.
-
Philip House
141 East 88th Street · Manhattan · Developer: The Cheshire Group, L.L.C.
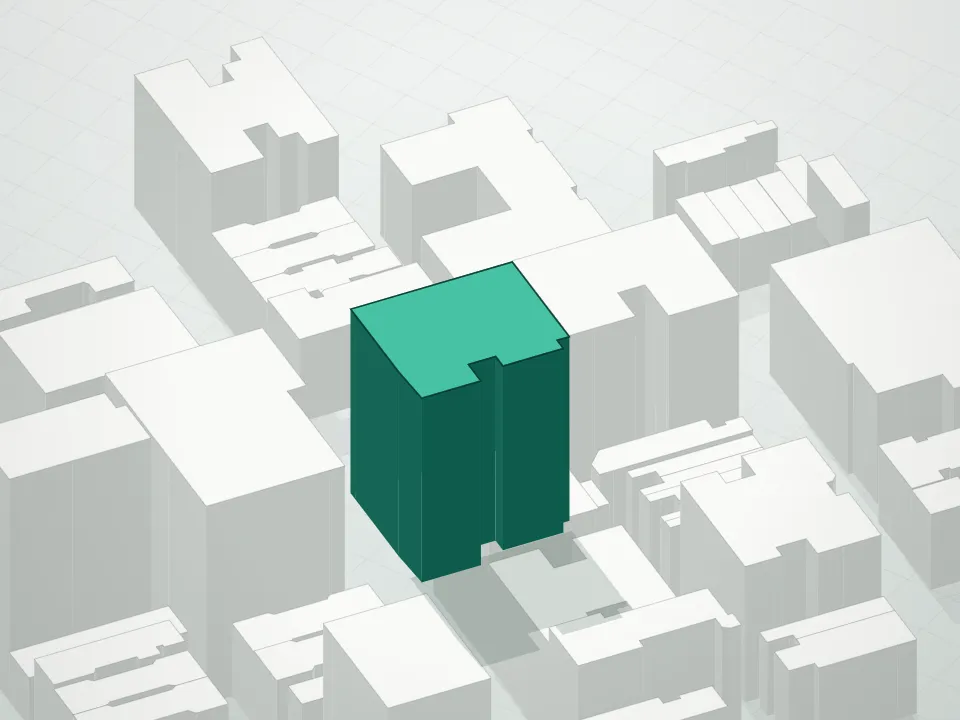
3D massing, not a photo. The building is in green. $53.6 million over Schedule A (+24.3%) across 55 matched homes. First closings ran from Jul 25, 2013 to Sep 13, 2019.
Our take: Priced in 2012, close to the bottom of the post-crisis market, and sold through the recovery. Homes that closed in 2013 came in near their lines; those that closed from 2014 to 2016 beat them by far more. Our read: a 2012 list carried into a 2014 market.
-
200 East 83rd Street
200 East 83rd Street · Manhattan · Developer: The Naftali Group

3D massing, not a photo. The building is in green. $27.6 million over Schedule A (+6.1%) across 83 matched homes. First closings ran from Sep 9, 2022 to Jul 12, 2024.
Our take: Launched in 2021, right as Manhattan's high end bounced back from the pandemic, and closed 2022 to 2024. The margin over list is modest, but almost every home beat its line, and later closings beat it by more. Our read: conservative launch pricing plus broad demand, not one or two trophy sales.
-
Greenwich West
110 Charlton Street · Manhattan · Developer: Cape Advisors

3D massing, not a photo. The building is in green. $26.3 million over Schedule A (+5.9%) across 168 matched homes. First closings ran from Oct 19, 2020 to May 28, 2026.
Our take: Priced in 2018, delivered into the 2020 slowdown, and still sold above its list, with the margin widening from 2022 on. Our read: a sponsor willing to hold inventory as the neighborhood around Hudson Square filled in, instead of discounting to sell out fast.
-
130 William
130 William Street · Manhattan · Developer: The Lightstone Group

3D massing, not a photo. The building is in green. $25.9 million over Schedule A (+4.5%) across 231 matched homes. First closings ran from Dec 2, 2020 to Jul 22, 2026.
Our take: A very large tower that closed most of its homes in 2021 at a little above list. The dollar figure comes from volume, hundreds of homes each a bit over their lines, not from big per-home gains, and the last few homes, in 2025 and 2026, closed below their lines. Our read: good timing on the 2021 rebound, not pricing power.
For every building, see the Sales & Sellout page, which shows homes closed and closings against Schedule A.
Why They Beat the List: What the Winners Share
We looked at each building's sales home by home, not just the totals. Our take on what the winners have in common:
- The list was old by closing day. Schedule A is written months or years before the first closing. Philip House priced in 2012 and sold into 2014; One57 priced in 2011 and closed mostly in 2014 and 2015; 516 Classon Avenue filed in late 2015 and sold through Brooklyn's run-up. The longer the gap in a rising market, the bigger the beat.
- Small buildings often filed placeholder lists. Round numbers that barely change with size, as at 27 Kossuth Place and 74-25 43rd Avenue, read like a floor the sponsor expected to raise, not a real price. When every home beats the list by a similar margin, that's repricing, not luck.
- The towers won on volume, not markup. Greenwich West, 130 William and 200 East 83rd Street beat their lists by modest margins, but across hundreds of homes. That's good timing and steady demand, not a list set far too low.
- The edge fades. At One57, 130 William, Sunlight Terrace and 516 Classon Avenue, the last homes to close beat the list by less or sold below it. Timing helps the sponsor most at launch, and early buyers most of all.
Each building's "Our take" above is our reading of its own sales record, not something the sponsor told us.
Part of the Gap Is Price Increases You Can Read About
The original Schedule A isn't the price you'll be quoted. Sponsors raise prices as a building sells, and they do it on paper: the plan reserves the right, and each increase is filed as an amendment (an update to the offering plan). The plan for 7 Whipple Street puts it this way:
"These offering prices, however, may only be changed by a duly filed amendment to this Plan when the change in price is an across the board change affecting one or more lines of Units or is to be advertised or is a price increase for an individual purchaser."
7 Whipple Street offering plan (CD180187), page 39
So a building that "beat" its launch list often did it through a string of filed increases, not one surprise. That's good news for early buyers and a warning for late ones.
What This Means for You
- Buying early can pay. In the buildings above, closings came in well over the launch list. If you can sign at or near Schedule A in a building that's selling well, that gap is your upside.
- Buying late, don't anchor to the launch price. The current price is whatever the latest amendment says. Ask for it.
- A rising price list isn't a guarantee. Most buildings closed below their original list. A sponsor raising prices on paper doesn't mean every home sold at the new number.
What to Ask, What to Check
- Ask for the latest price amendment. Have your attorney compare the price you're offered with the original Schedule A and every filed increase.
- Check recorded closings in ACRIS. Deeds show what neighbors actually paid, not what was asked.
- Ask how many homes are in contract and closed. Contracts aren't public; closings are. Compare the sales office's number with the building's page on our Sales & Sellout page.
- Ask if the layout matches the plan. Sponsors sometimes combine or reconfigure homes after filing. If your home isn't on the original Schedule A, ask for the amendment that created it.
- Read the "Changes in Prices and Units" section. It tells you what the sponsor can change without asking you. See how to find offering plan amendments.
Common Questions
What is Schedule A in a condo offering plan?
It's the sponsor's original price list: each home's asking price, size and estimated monthly charges, as filed with the Attorney General. Prices can change later by amendment. See Schedule A and Schedule B explained.
Do new NYC condos usually sell above their offering plan prices?
No. In our data the median building closed 2.7% below its original Schedule A, and only 40% closed above it in total.
Why would a closing price be far above Schedule A?
Common reasons: the sponsor filed price increases as the building sold, or the market rose between launch and closing. A home that was combined with another after the plan was filed can also look far above its original line, so we leave buildings like that out.
Can I negotiate below the current price list?
Often, yes. A plan may say outright that prices are negotiable (7 Whipple Street's does), and most buildings in our data closed below their original list. Ask your broker and attorney what recent closings in the building show.
We compared each home's first recorded sale (deeds and, for buildings on leased land, transfer tax filings of $10,000 or more in ACRIS, matched to units through the Digital Tax Map) with its price in the offering plan's original Schedule A, summed per building. Sales covering more than one home are left out. A building is included if its plan was accepted in 2010 or later and at least 10 matched homes make up half or more of it. Buildings whose Schedule A doesn't describe the homes that sold, such as 360 Central Park West, where the sponsor combined apartments after filing, are left out. Developers come from the offering plans or, where the plan doesn't name the firm, a cited public source; none is shown when we couldn't find one. Prices are not adjusted for inflation, and amendment price increases aren't separated out. The pictures are 3D massing drawings, not photos. ACRIS data through Aug 31, 2026. Updated as of Oct 13, 2026.
Cite This Research
The Condo Book Project, “Which NYC Condos Sold for More Than Their Price List?,” Condo Book Research, updated Oct 10, 2026, https://www.condobooknyc.com/research/developers-who-timed-nyc-condo-market.html.
The figures are recomputed from the plan records each time the site is rebuilt, so cite the date you read them.